Quickly Build Intelligent Sales Analysis Reports
In the digital era, intelligent analysis of sales data is becoming a crucial tool for enterprise decision-making. This tutorial uses the coffee category sales data of a fast-moving consumer goods company as an example to guide you through quickly building a natural language-driven intelligent sales analysis report, achieving a fully automated analysis process from data to insights.
You only need to input a natural language sentence, such as "Analyze the coffee sales trend of each store last quarter." The system will automatically recognize the business intent, optimize and generate SQL query statements, extract the required information from the data source, and automatically generate chart reports. Whether it is sales comparison of different flavors, sales heatmaps across regions, or promotional activity effect analysis, all can be completed with one click.
The generated reports support style customization, flexible chart type switching, and can enable AI insight features to help you automatically identify key factors behind sales fluctuations, timely discover growth opportunities or potential issues.
This tutorial is suitable for data analysis beginners, business managers, and enterprise users who want to quickly validate sales strategies. It is an ideal starting point for building practical and intelligent sales analysis reports.
Coffee Sales Data Preparation
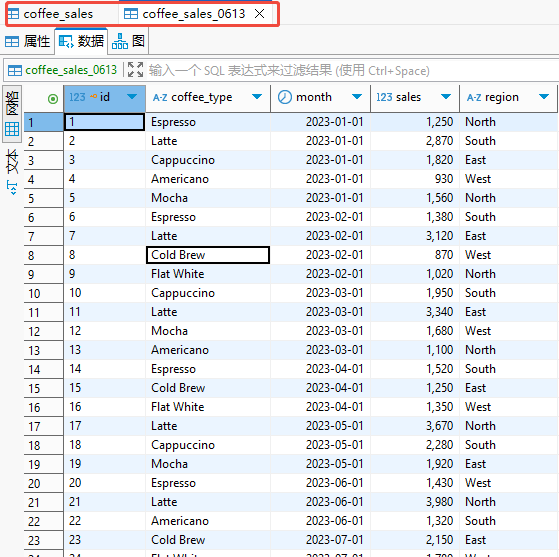
Before building the report, you need to prepare the coffee sales data. In this tutorial, we use the coffee category sales data from a fast-moving consumer goods company’s daily sales, stored in a SQL Server database, mainly containing two data tables:
coffee_salescoffee_sales_0613
Importing sales data into the database is a prerequisite for the system to recognize and analyze the data. Besides SQL Server, you can also choose to store data in other compatible data platforms such as: MySQL, Azure Databricks
After data import is complete, you need to obtain the database connection information, including:
- Host (database address)
- Port (port number)
- Username
- Password
- Database name
This information will be used later when adding the data source.
Add Coffee Sales Data as Data Source
Next, we need to add the coffee sales data tables in the database as system-recognizable data sources. The steps are as follows:
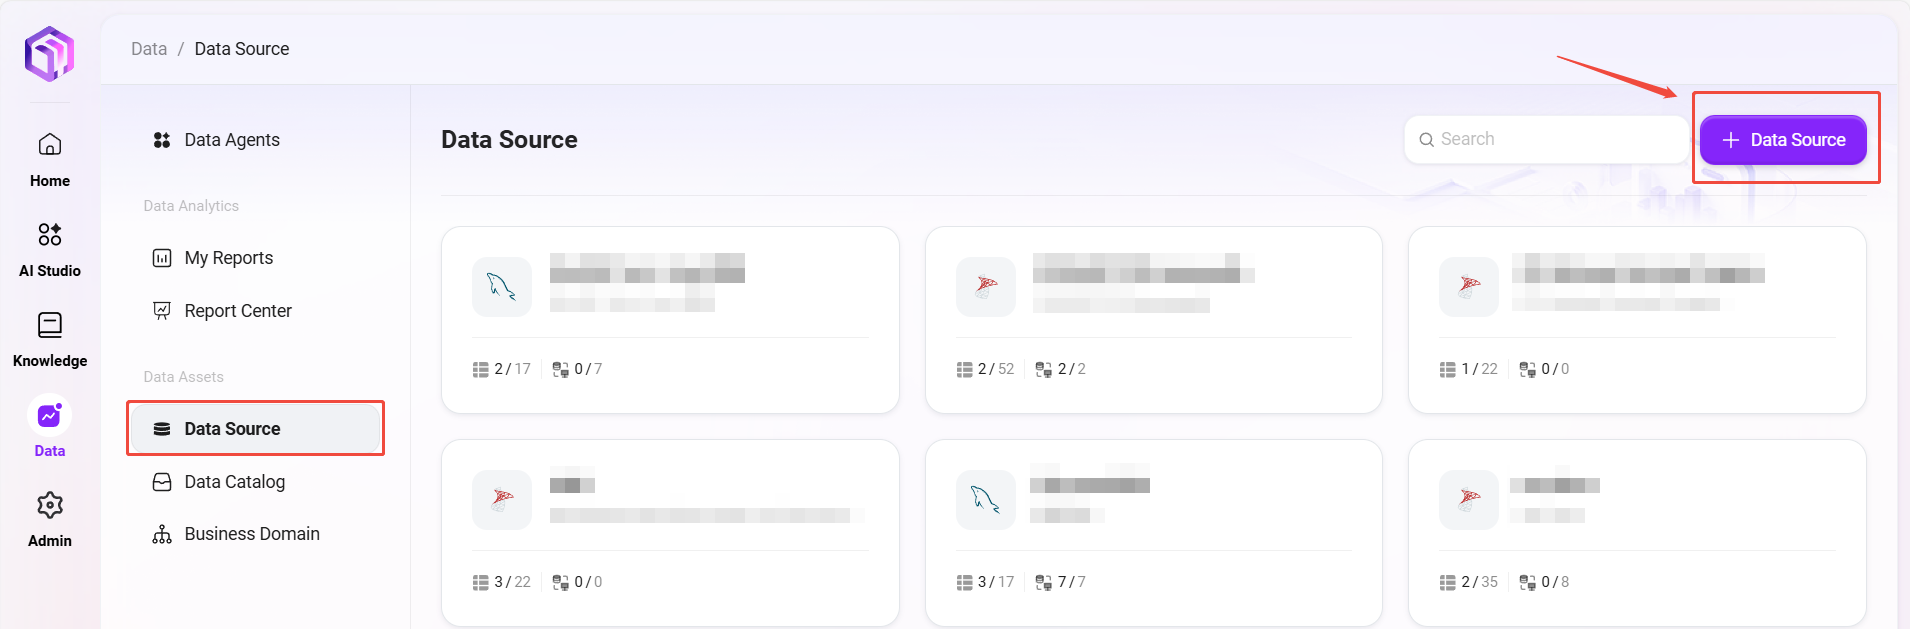
- Enter the Data module in the system.
- Click "Data Sources" in the left sidebar.
- On the data source page, click the "Add Data Source" button at the top right.
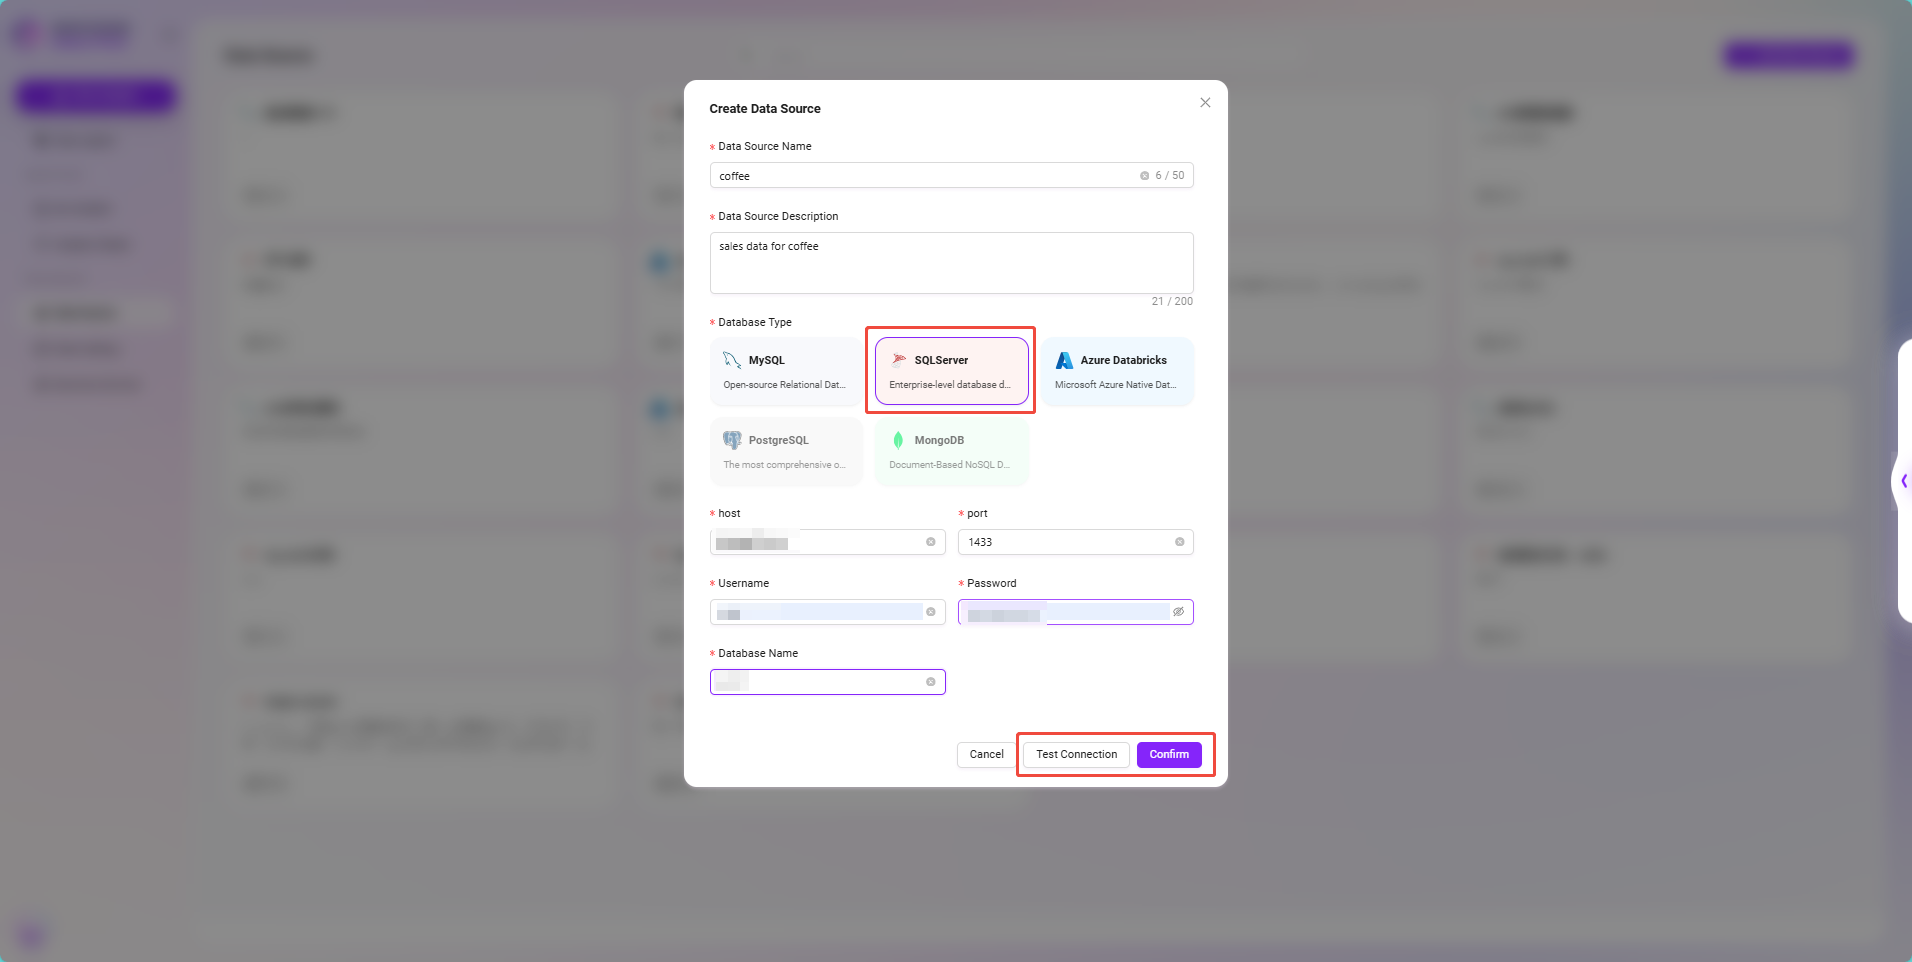
- On the "Create Data Source" page, fill in the following information:
- Data Source Name:
coffee - Data Source Description:
sales data for coffee - Database Type: select
SQL Server - Host: enter the database address
- Port: enter the port number
- Username / Password: enter the authentication information required for connection
- Database Name: enter the database name where sales data is stored
- Data Source Name:
- Click "Test Connection" below to verify if the information is correct.
- After passing the test, click "Confirm" to complete adding the data source.
At this point, the system has successfully established a connection with the database.
Select Coffee Sales Data Tables
After creating the data source, you also need to specify the actual data tables to use:
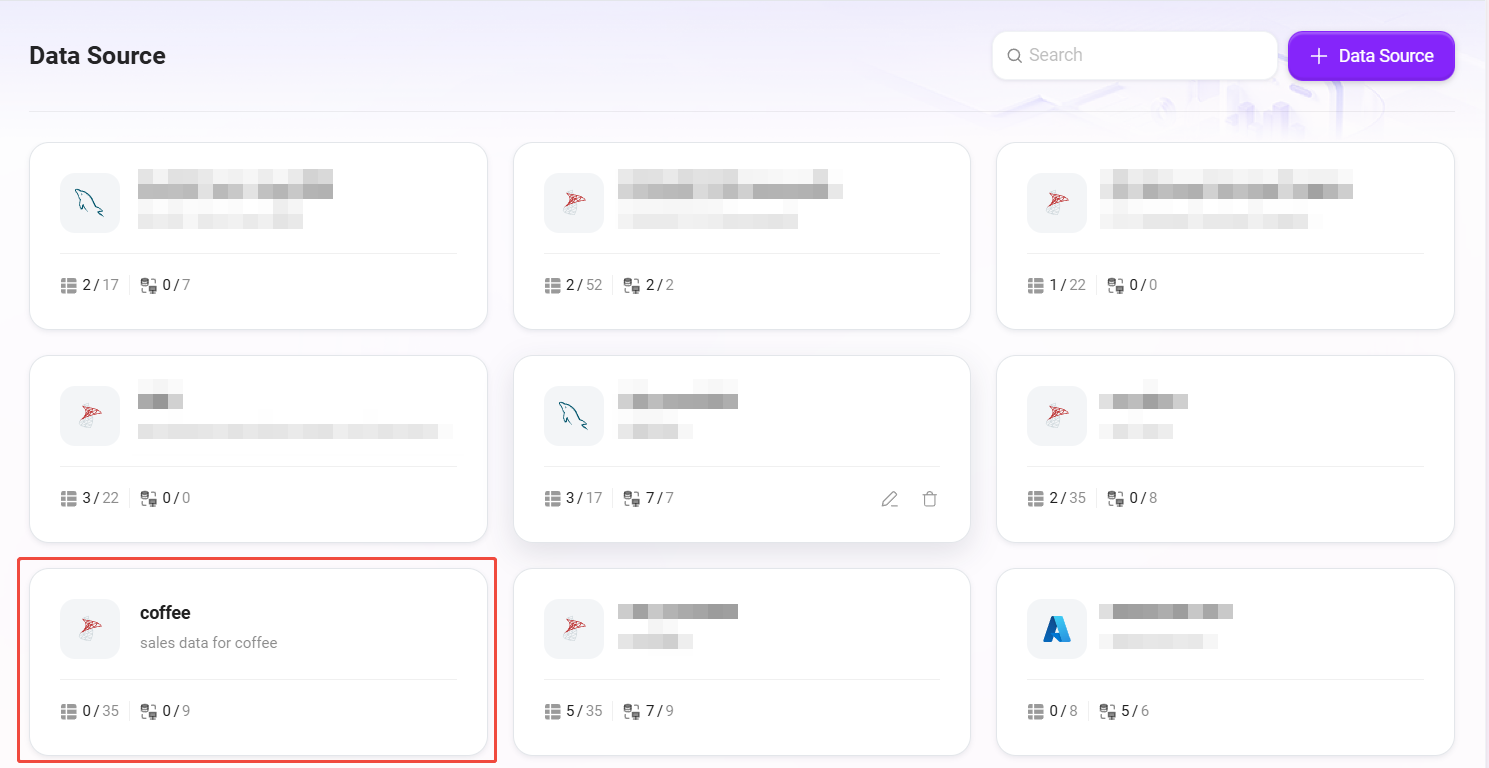
- Return to the data source list and click the newly created
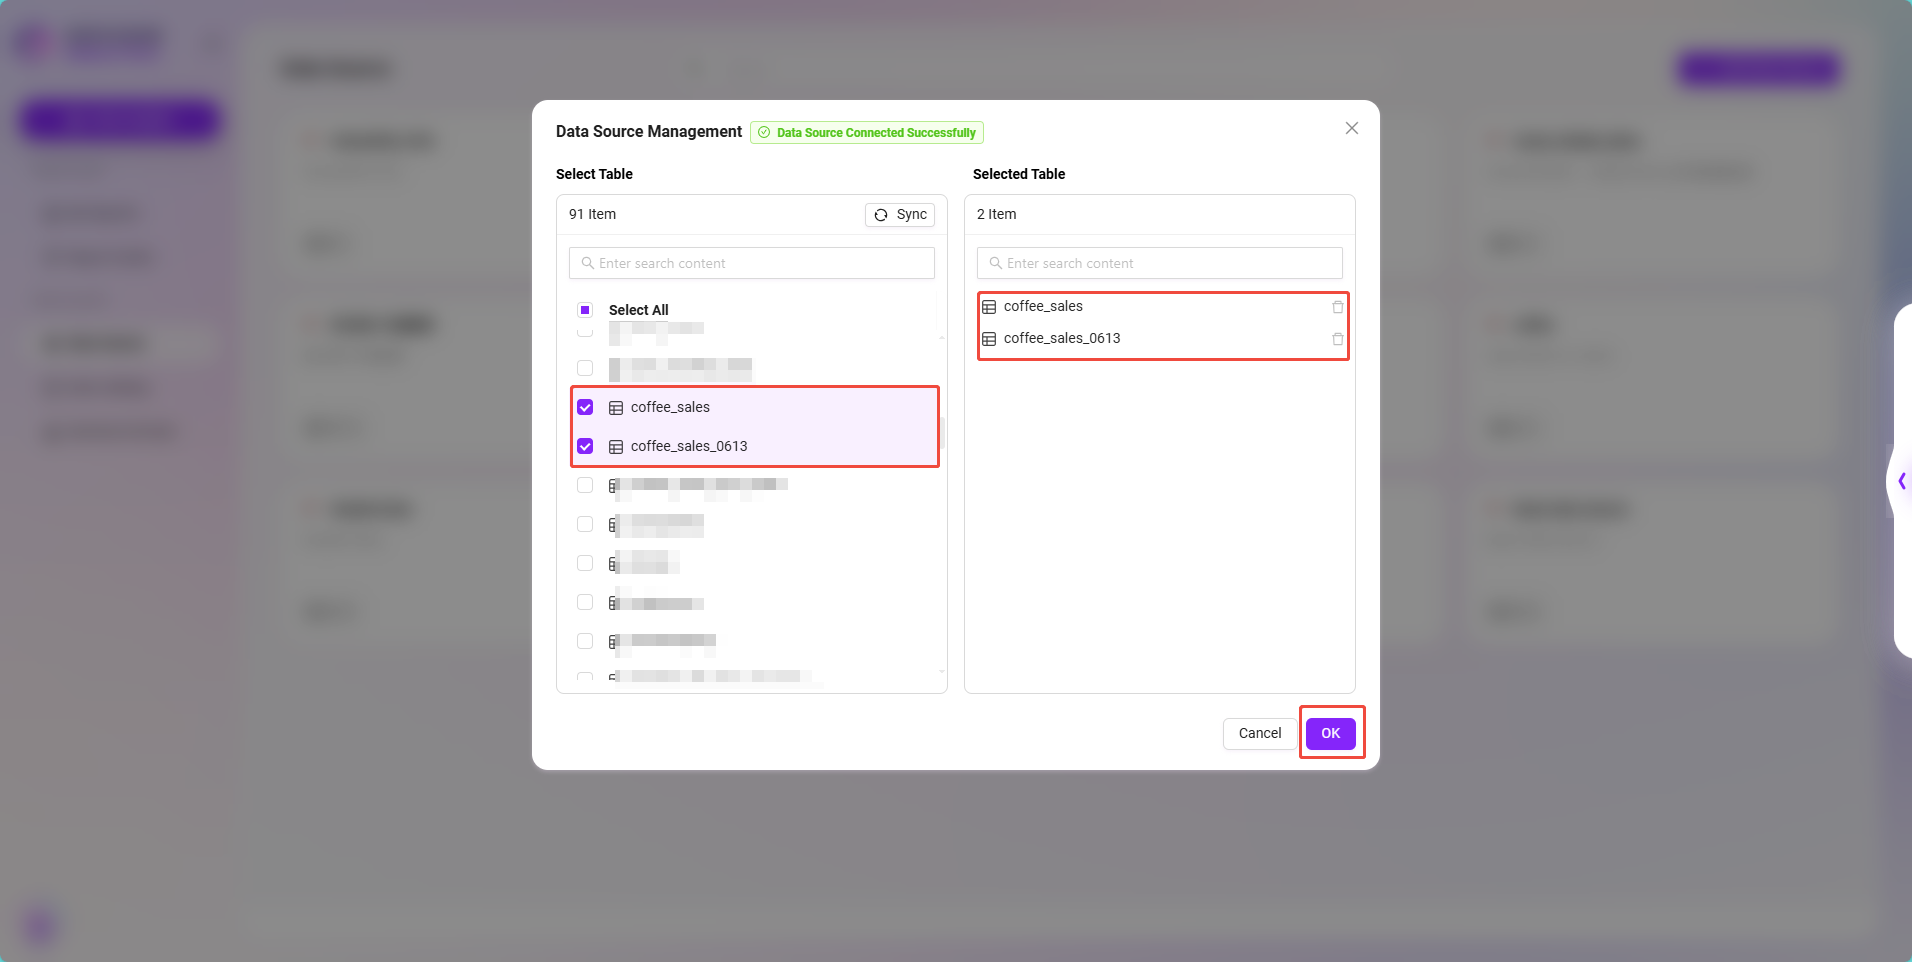
coffeedata source. - On the data source details page, select the following two tables as analysis targets:
coffee_salescoffee_sales_0613
- Select and confirm adding them. This step ensures the system correctly reads and loads the coffee sales data.
At this point, the coffee sales data has been officially connected to the system as a data source, ready for the next step of intelligent analysis construction.
Synchronize Coffee Sales Data to Data Catalog
Although we have successfully added the coffee sales data tables as data sources earlier, the system currently cannot view the field structures of these two tables, nor does it have any business semantic descriptions of the fields. Therefore, the next step is to synchronize the table structures in the data catalog and supplement field information to improve the readability and accuracy of subsequent data analysis.
Synchronization Steps
- Enter the system’s Data module.
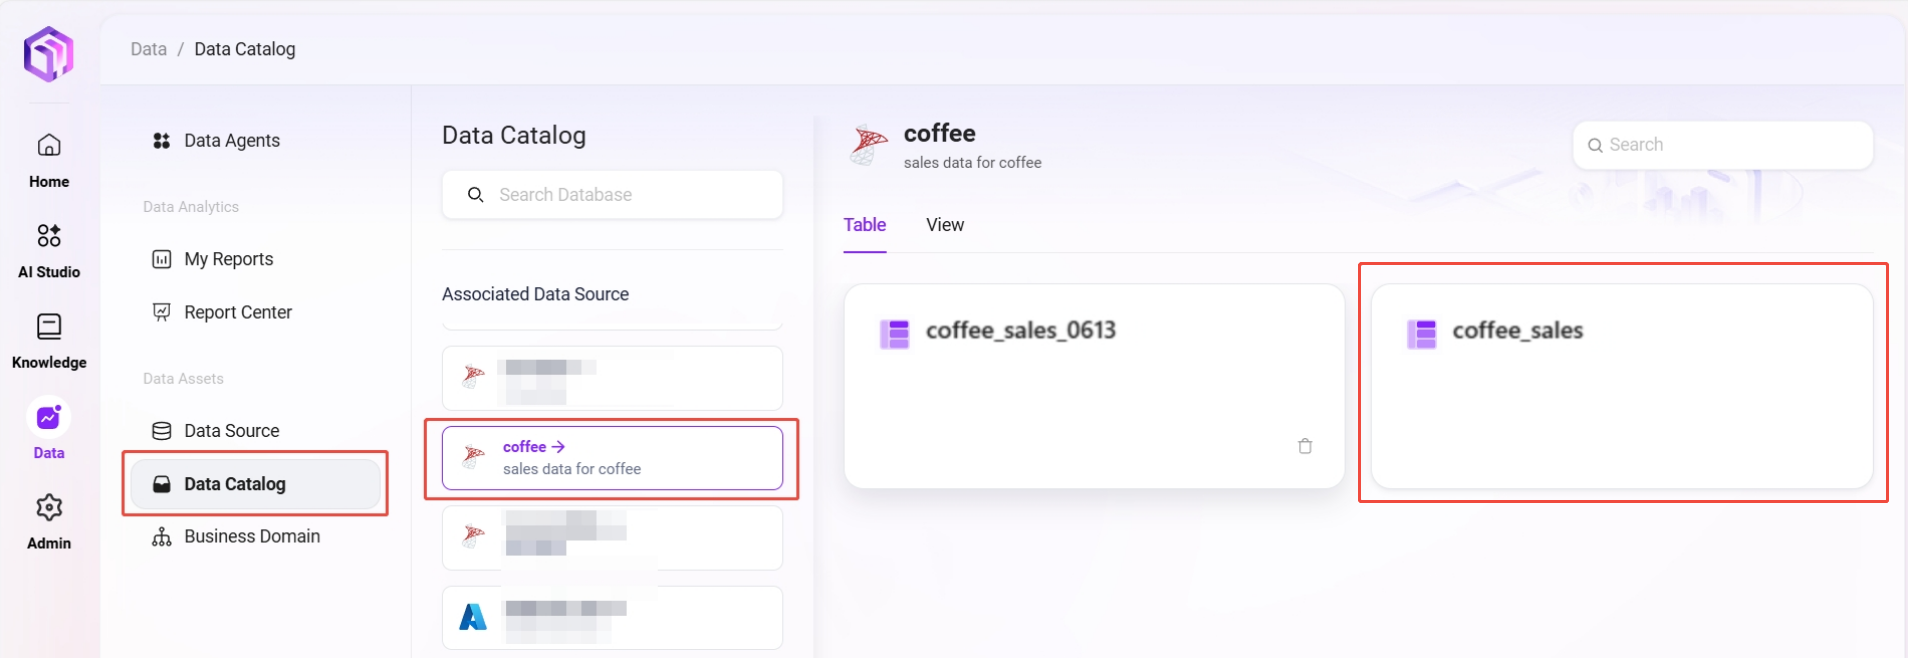
- Click "Data Catalog" in the left sidebar.
- Under the "Belonging Data Source" section on the page, find the previously added data source
coffee. - The system will display the two data tables under this data source on the right:
coffee_salescoffee_sales_0613
- Click to enter the second table
coffee_sales.
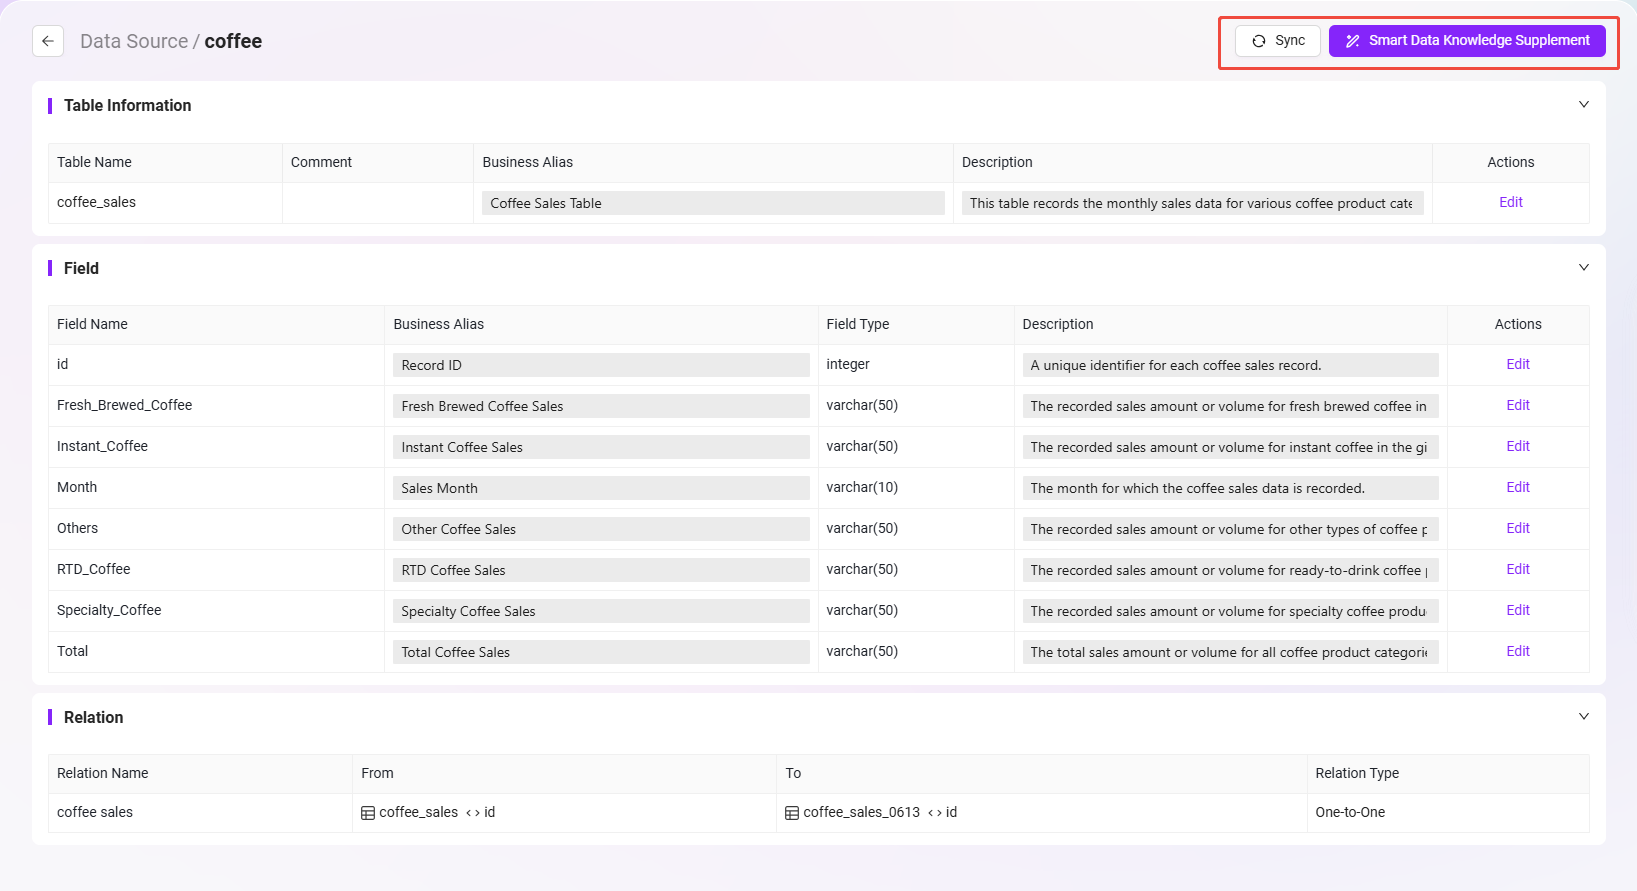
- On the table details page, click the "Synchronize" button at the top right:
- The system will automatically pull and display the field structure of the table from the database, including field names and types.
- After synchronization, click the "Intelligent Data Knowledge Supplement" at the top right:
- The system will intelligently supplement business aliases, field descriptions, and other information based on field names.
- If the generated results do not match the actual business, you can manually modify the field descriptions to ensure accuracy.
- Repeat the same operation for the second table
coffee_sales_0613to synchronize and supplement field descriptions.
Through structure synchronization and field supplementation in the data catalog, the system can correctly recognize the meaning of fields, thereby providing more accurate support when generating reports and insights later.
Create Business Domain for Coffee Sales Data
To better organize and manage sales data and improve reusability and maintainability when building intelligent analysis reports later, we need to create an independent Business Domain for the coffee sales data.
Steps to Create Business Domain:
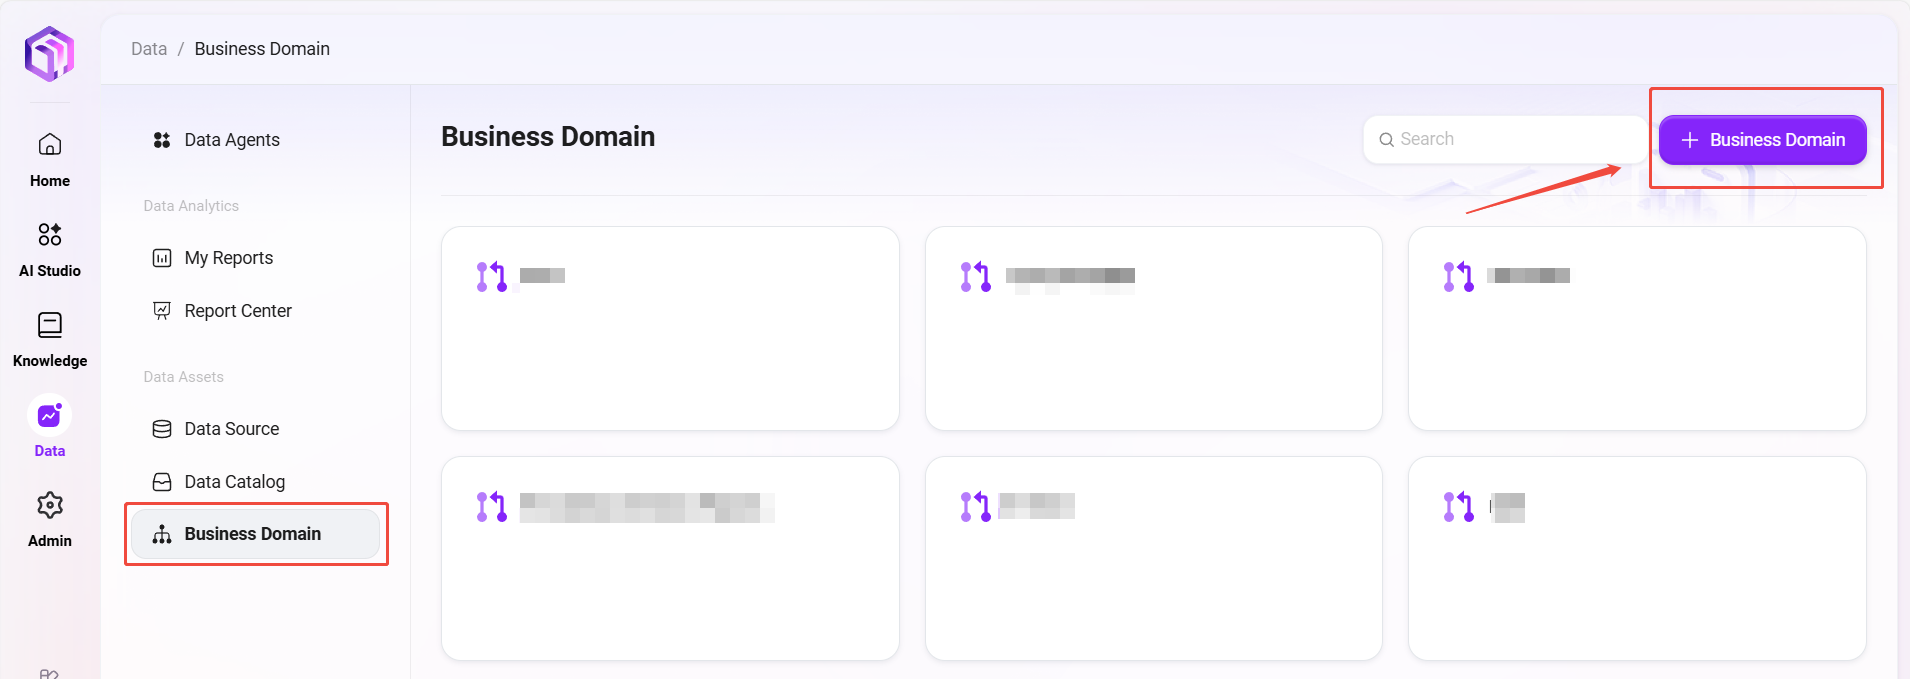
- In the system’s Data module, click "Business Domain" in the left sidebar.
- Click the "+ Business Domain" button at the top right to enter the business domain creation page.
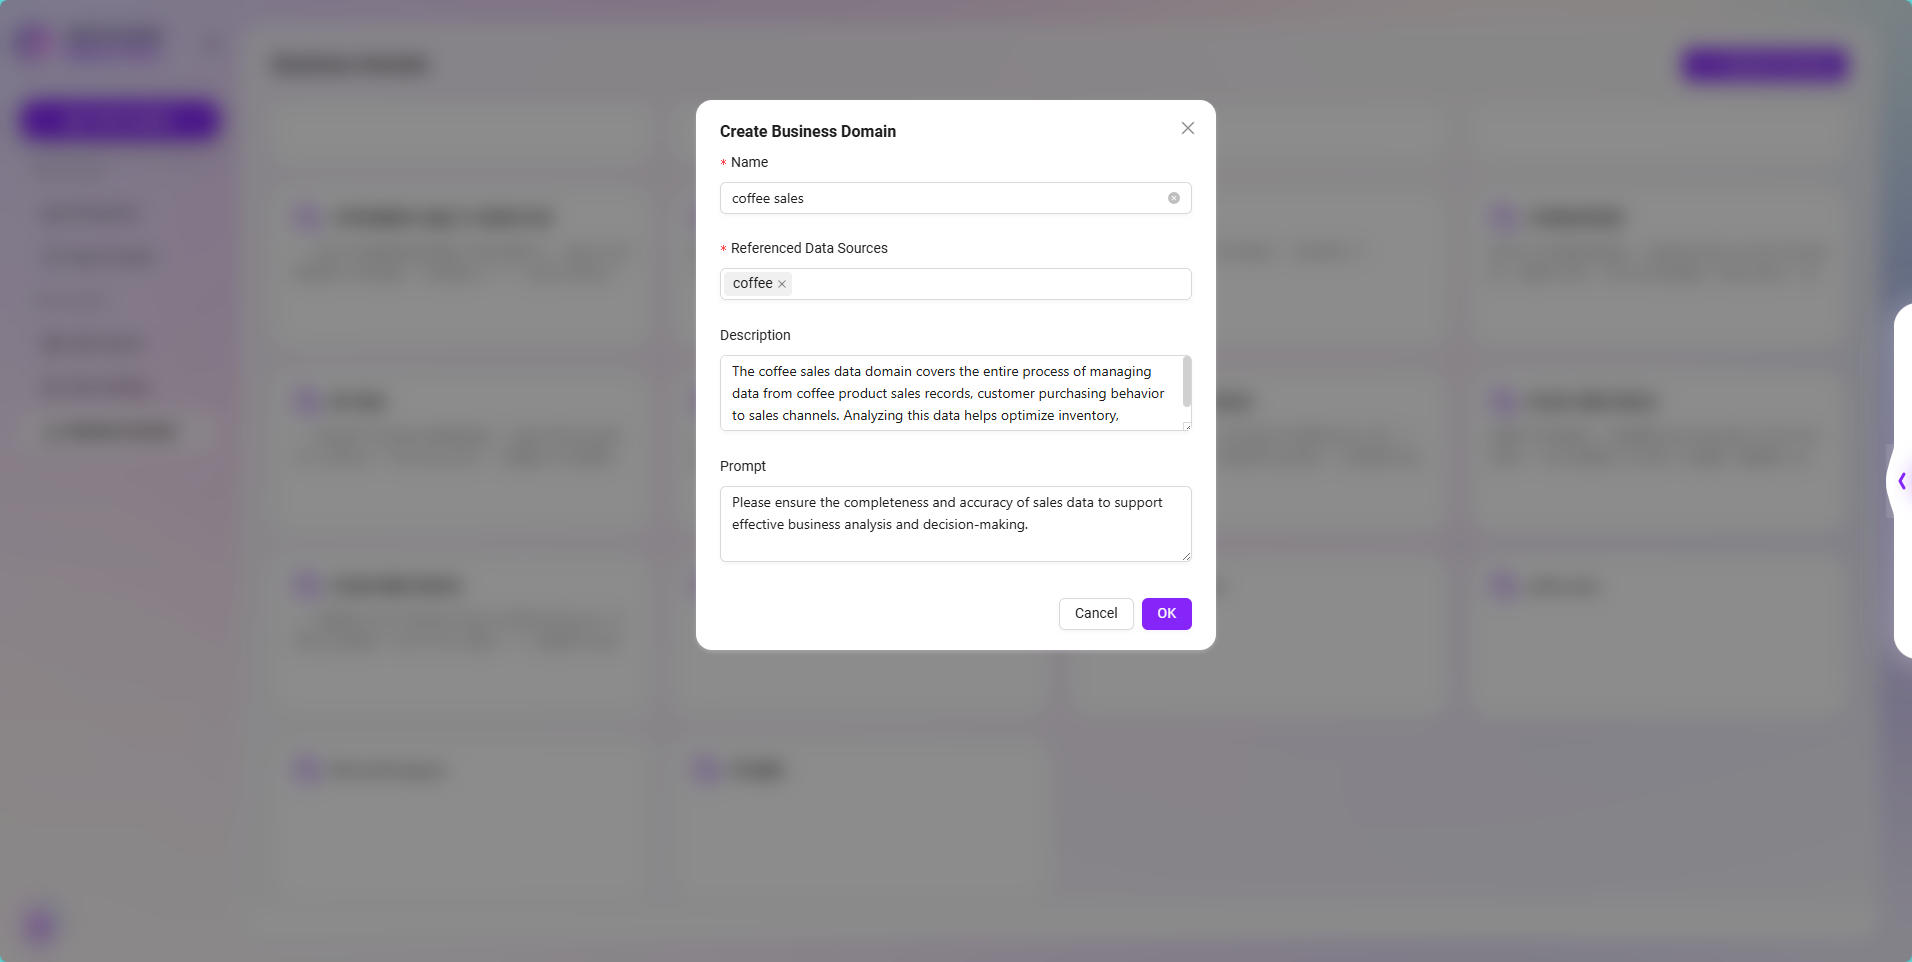
- Fill in the following information:
- Business Domain Name:
coffee sales - Select Data Source: choose the previously created data source
coffeefrom the dropdown - Business Domain Description:
The coffee sales data domain covers the entire process of managing data from coffee product sales records, customer purchasing behavior to sales channels. Analyzing this data helps optimize inventory, improve sales strategies, and enhance customer satisfaction. - Prompt Information:
Please ensure the completeness and accuracy of sales data to support effective business analysis and decision-making.
- Business Domain Name:
- After filling in the information, click "Confirm" to complete the creation of the business domain.
Configure Business Domain Table Relationships
After the business domain is successfully created, the system will automatically enter the business domain configuration page. At this point, you need to add the actual coffee sales data tables to the business domain panel and configure the logical relationships between them.
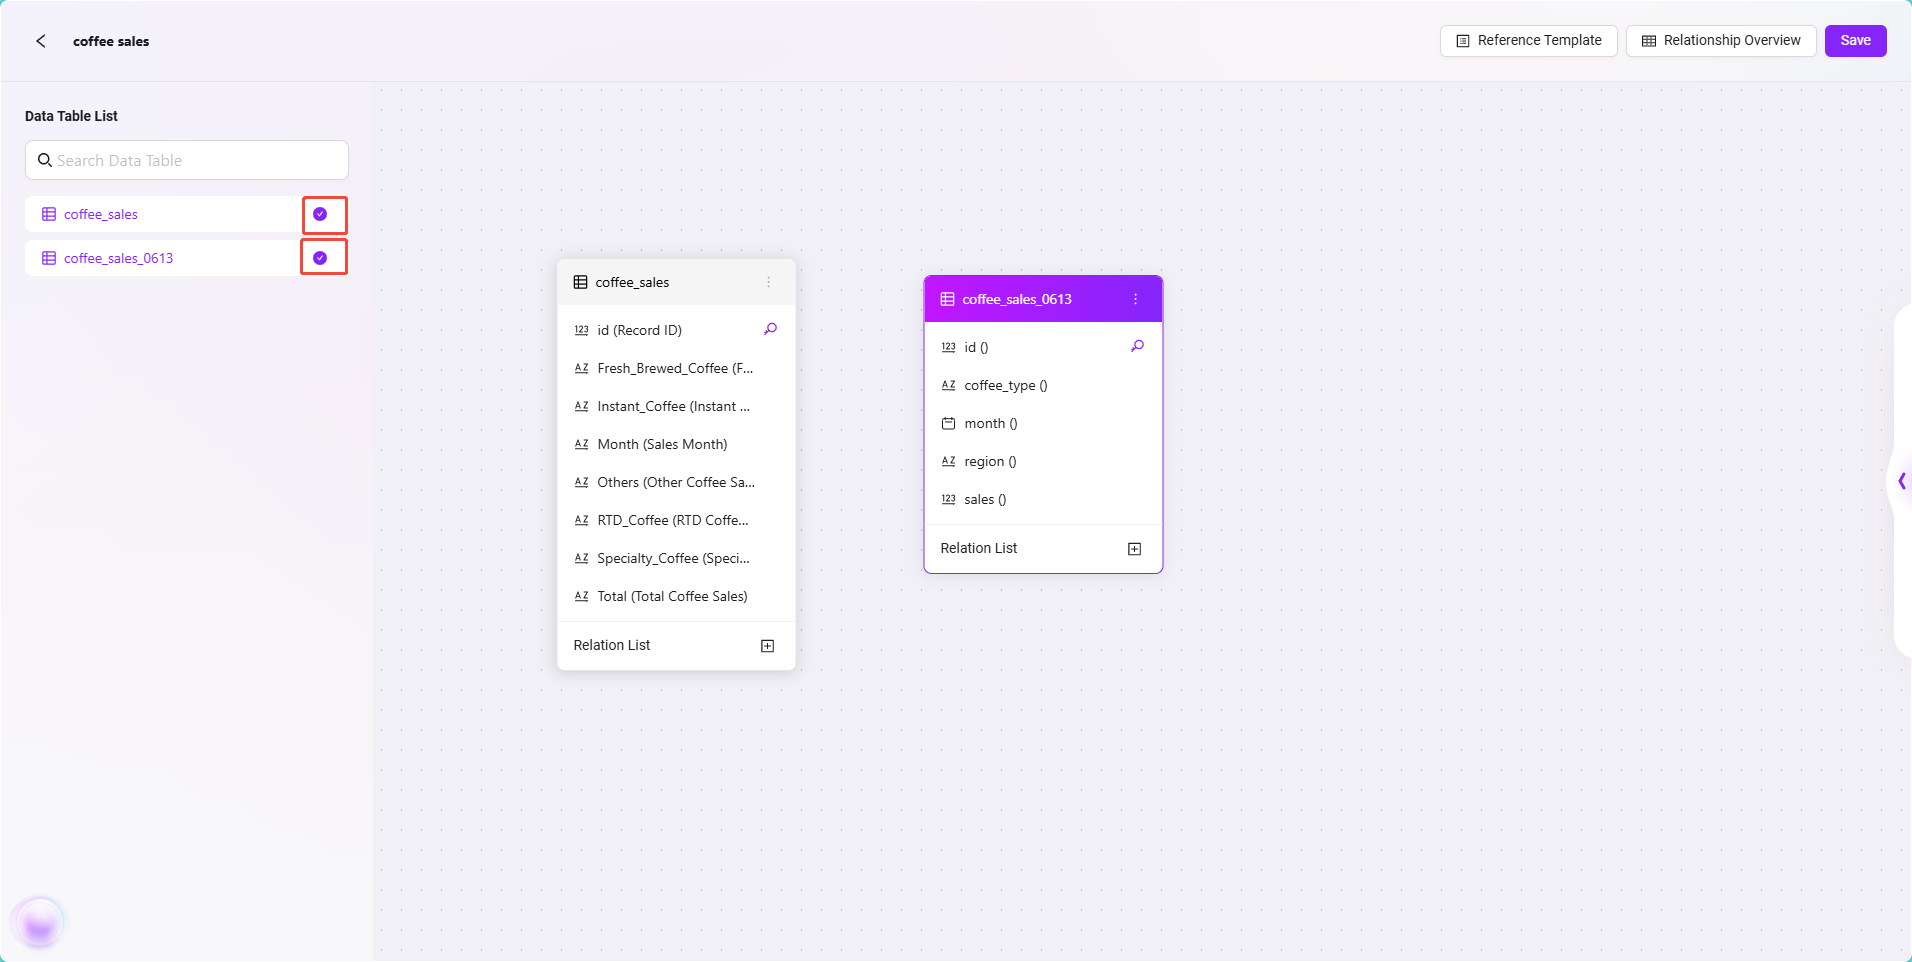
Add Data Tables to Business Domain Panel:
- In the business domain configuration interface, select and check the two tables:
coffee_salescoffee_sales_0613
- After checking, the two tables will appear in the business domain panel.
Create Relationships Between Tables:
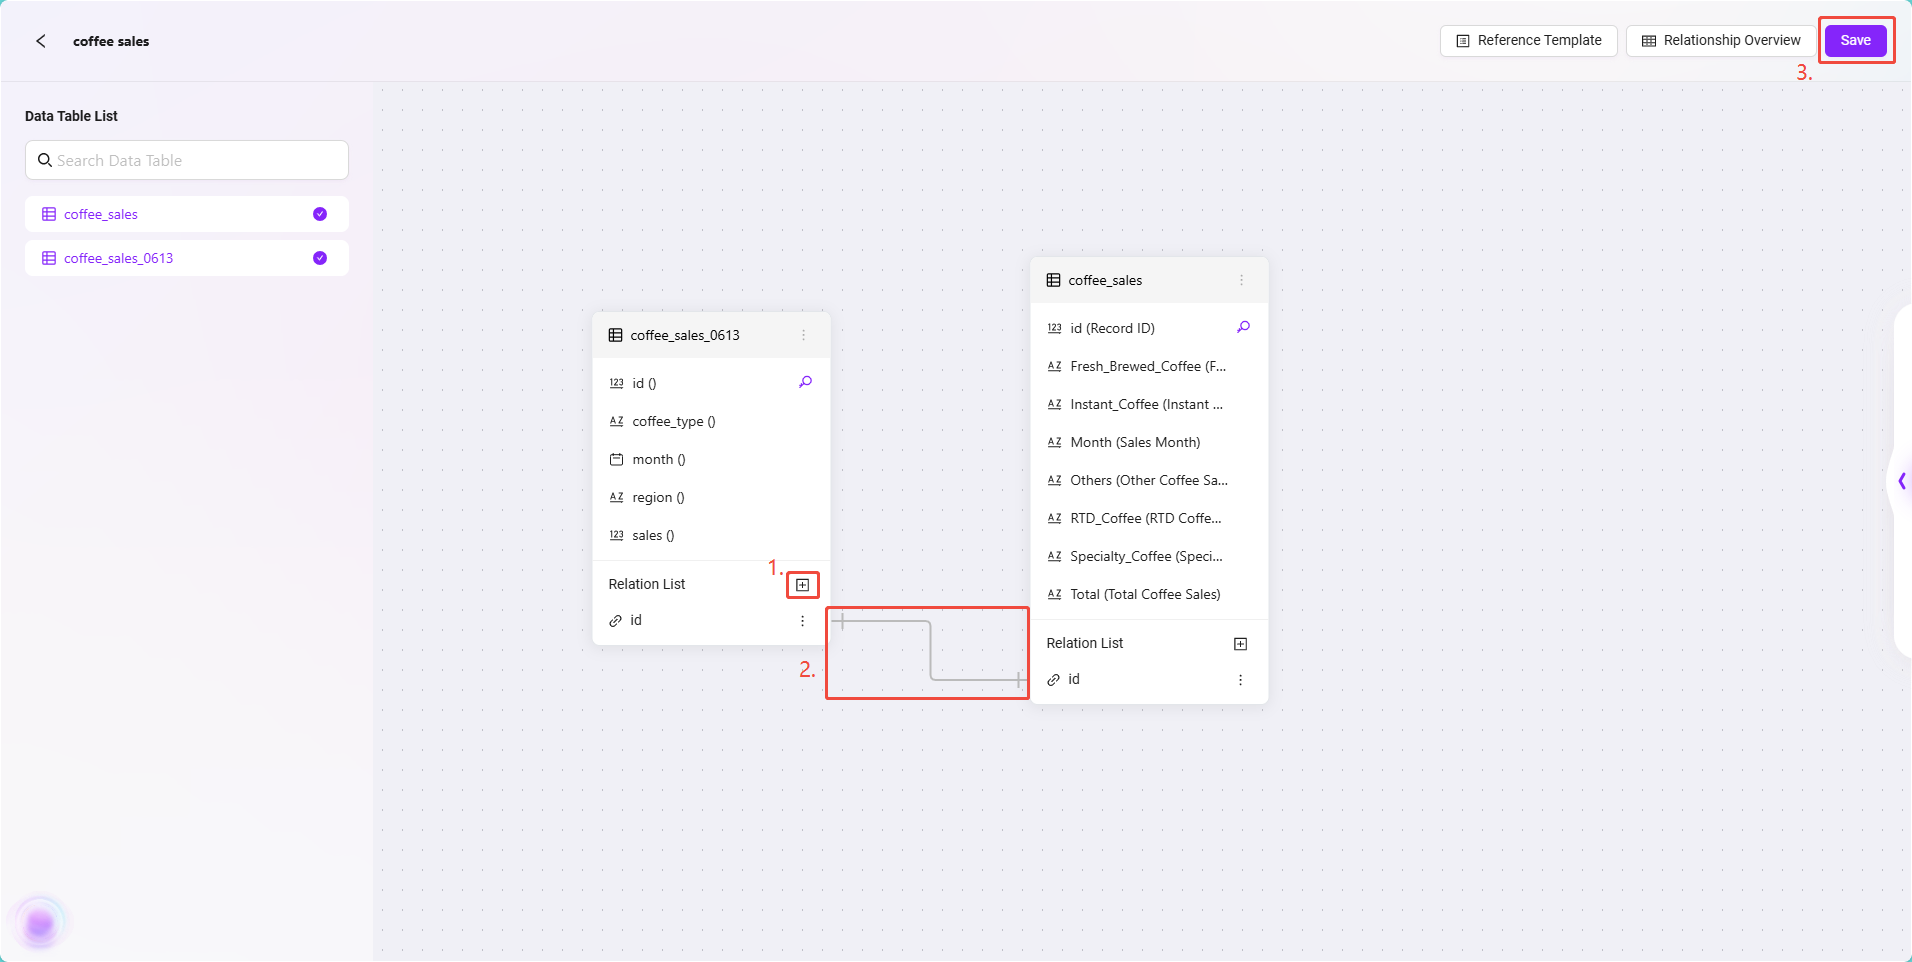
- In the panel, find the
coffee_sales_0613table and locate the "Relationship List" below the table. - Click the "+" button to create a new relationship.
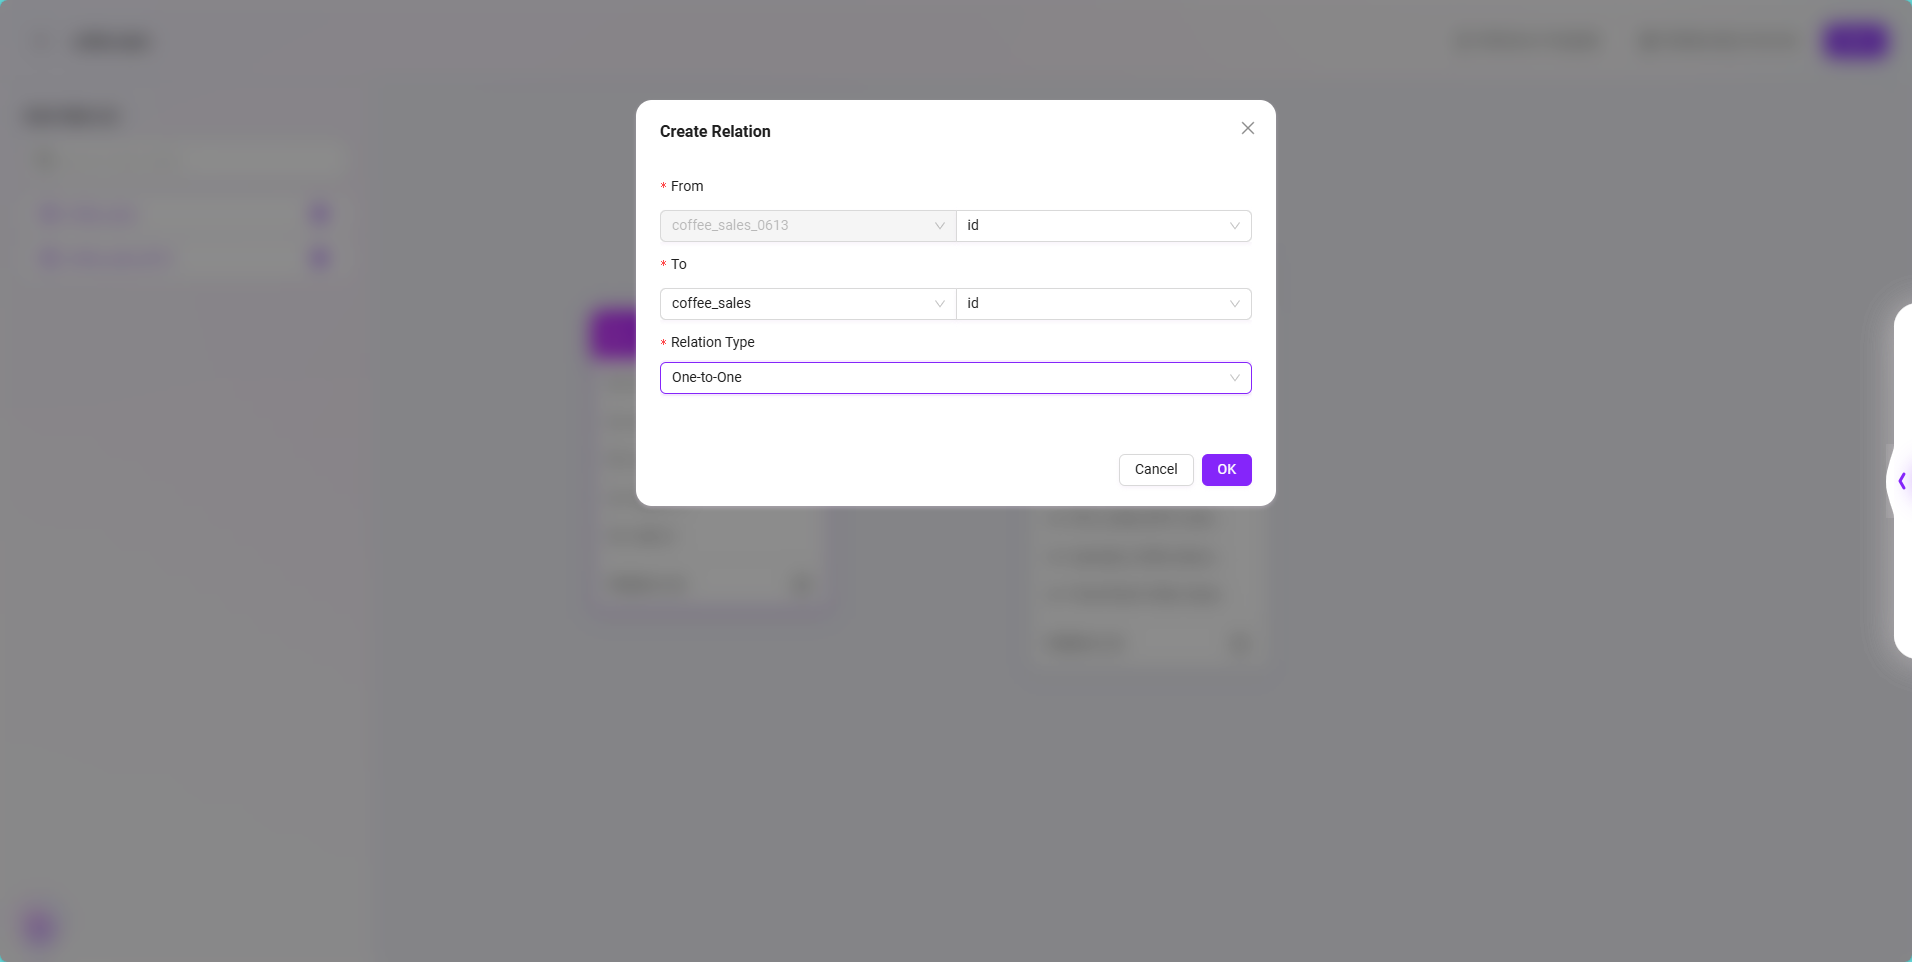
- In the popped-up relationship setting dialog, fill in the following:
- From Table Field:
coffee_sales_0613.id - To Table Field:
coffee_sales.id - Relation Type: select "One-to-One"
- From Table Field:
- Click "Confirm" to complete the relationship creation.
- After creation, the panel will display a one-to-one relationship line connecting the two tables.
Save Business Domain Relationship Configuration:
Click the "Save" button at the top right. The system will store the currently configured table structures and relationship settings.
At this point, the business domain configuration is complete, laying a solid foundation for building intelligent reports later. The system will more accurately parse data fields and understand data semantics based on this, supporting natural language analysis and chart generation.
Create Intelligent Sales Analysis Report
After completing data access, data catalog configuration, and business domain construction, we are fully prepared to build intelligent BI reports. Next, we will start officially creating the sales analysis report.
Enter Intelligent BI Analysis Module
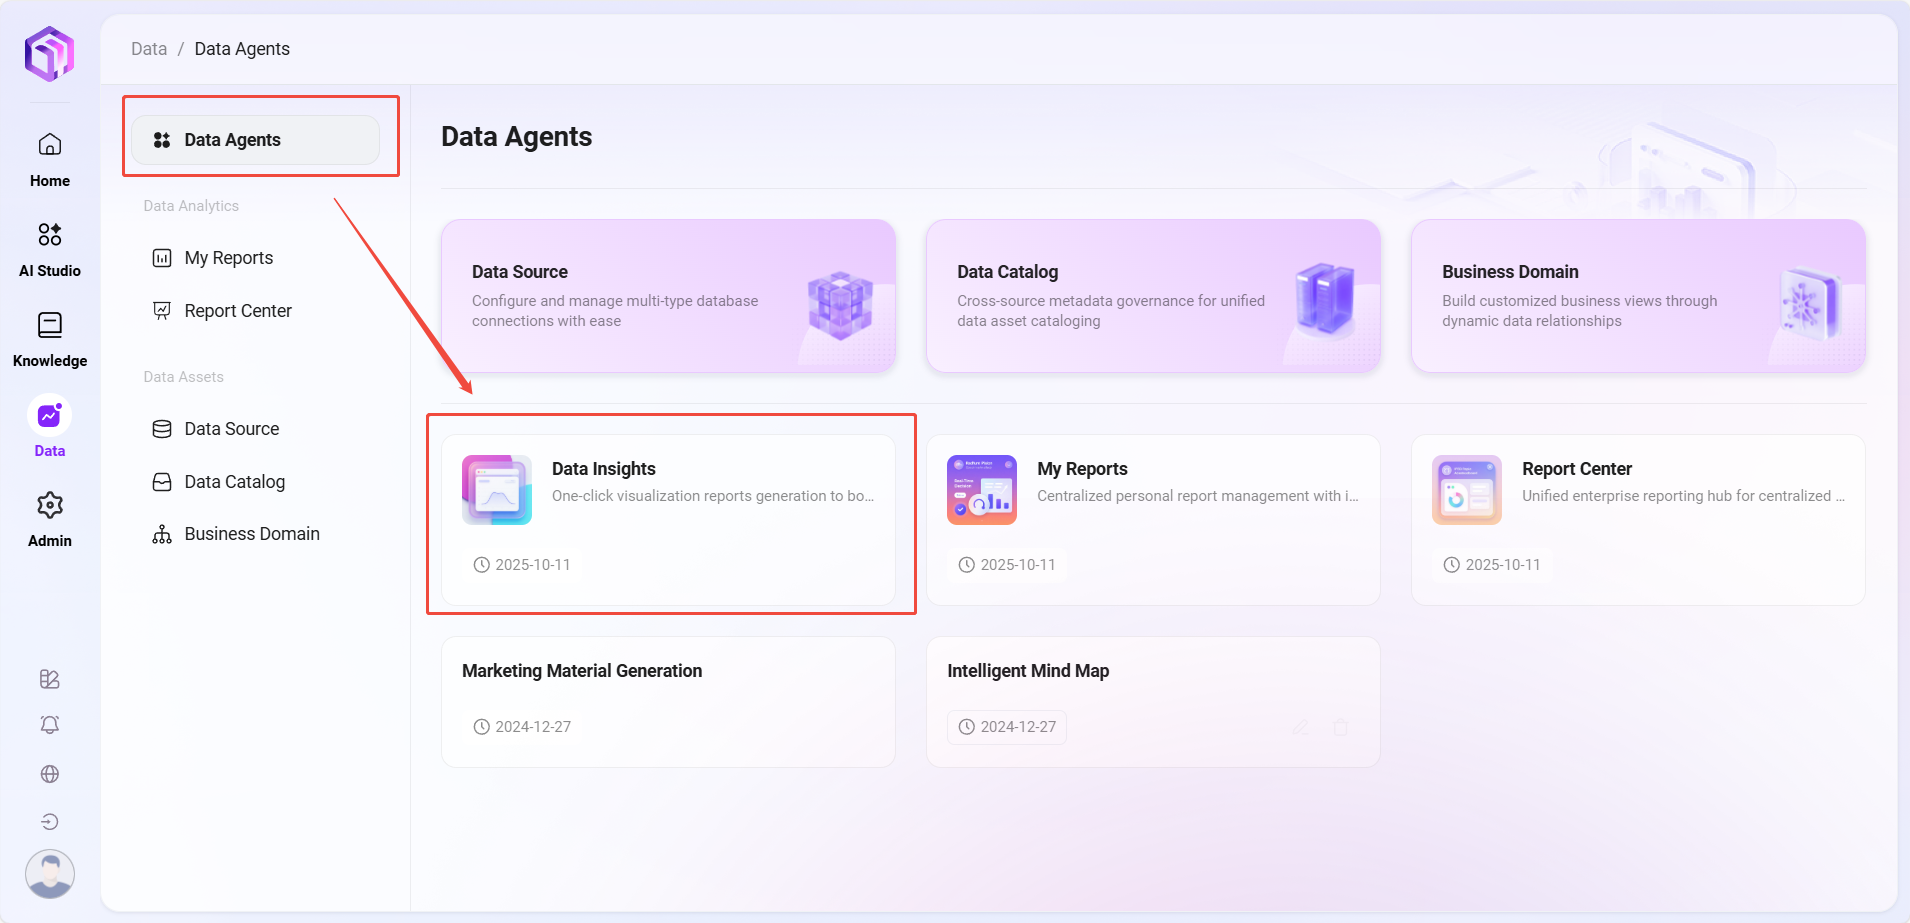
- Enter the system’s Data module.
- Click "Data Agents" in the left sidebar.
- In Data Agents, click "Intelligent BI".
- The system will jump to the intelligent BI report creation interface.
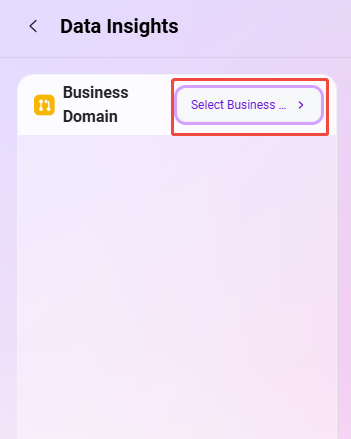
Select Business Domain
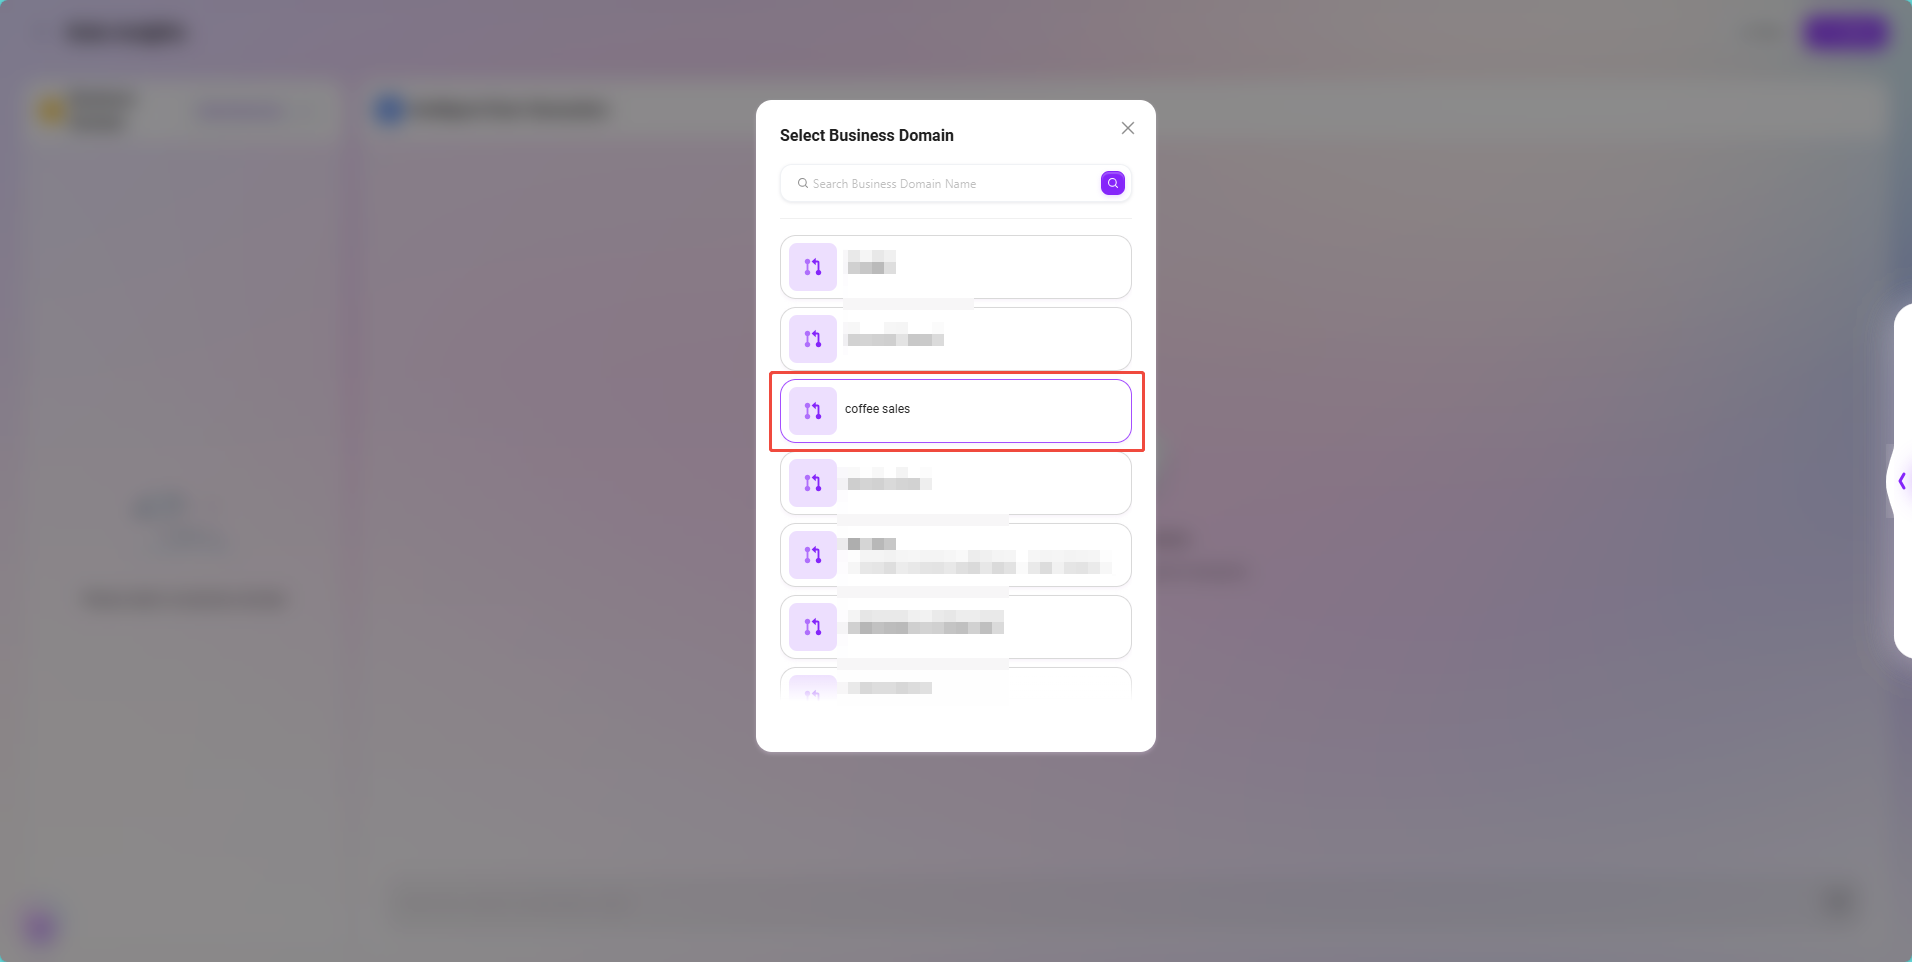
- Click "Select Business Domain" on the left side of the page.
- In the popped-up business domain list, select the previously created business domain
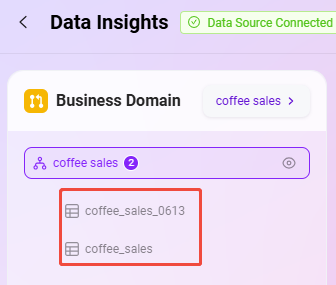
coffee sales. - After successful selection, the page will automatically load the two tables under this business domain:
coffee_salescoffee_sales_0613These data tables will serve as the data foundation for subsequent analysis.
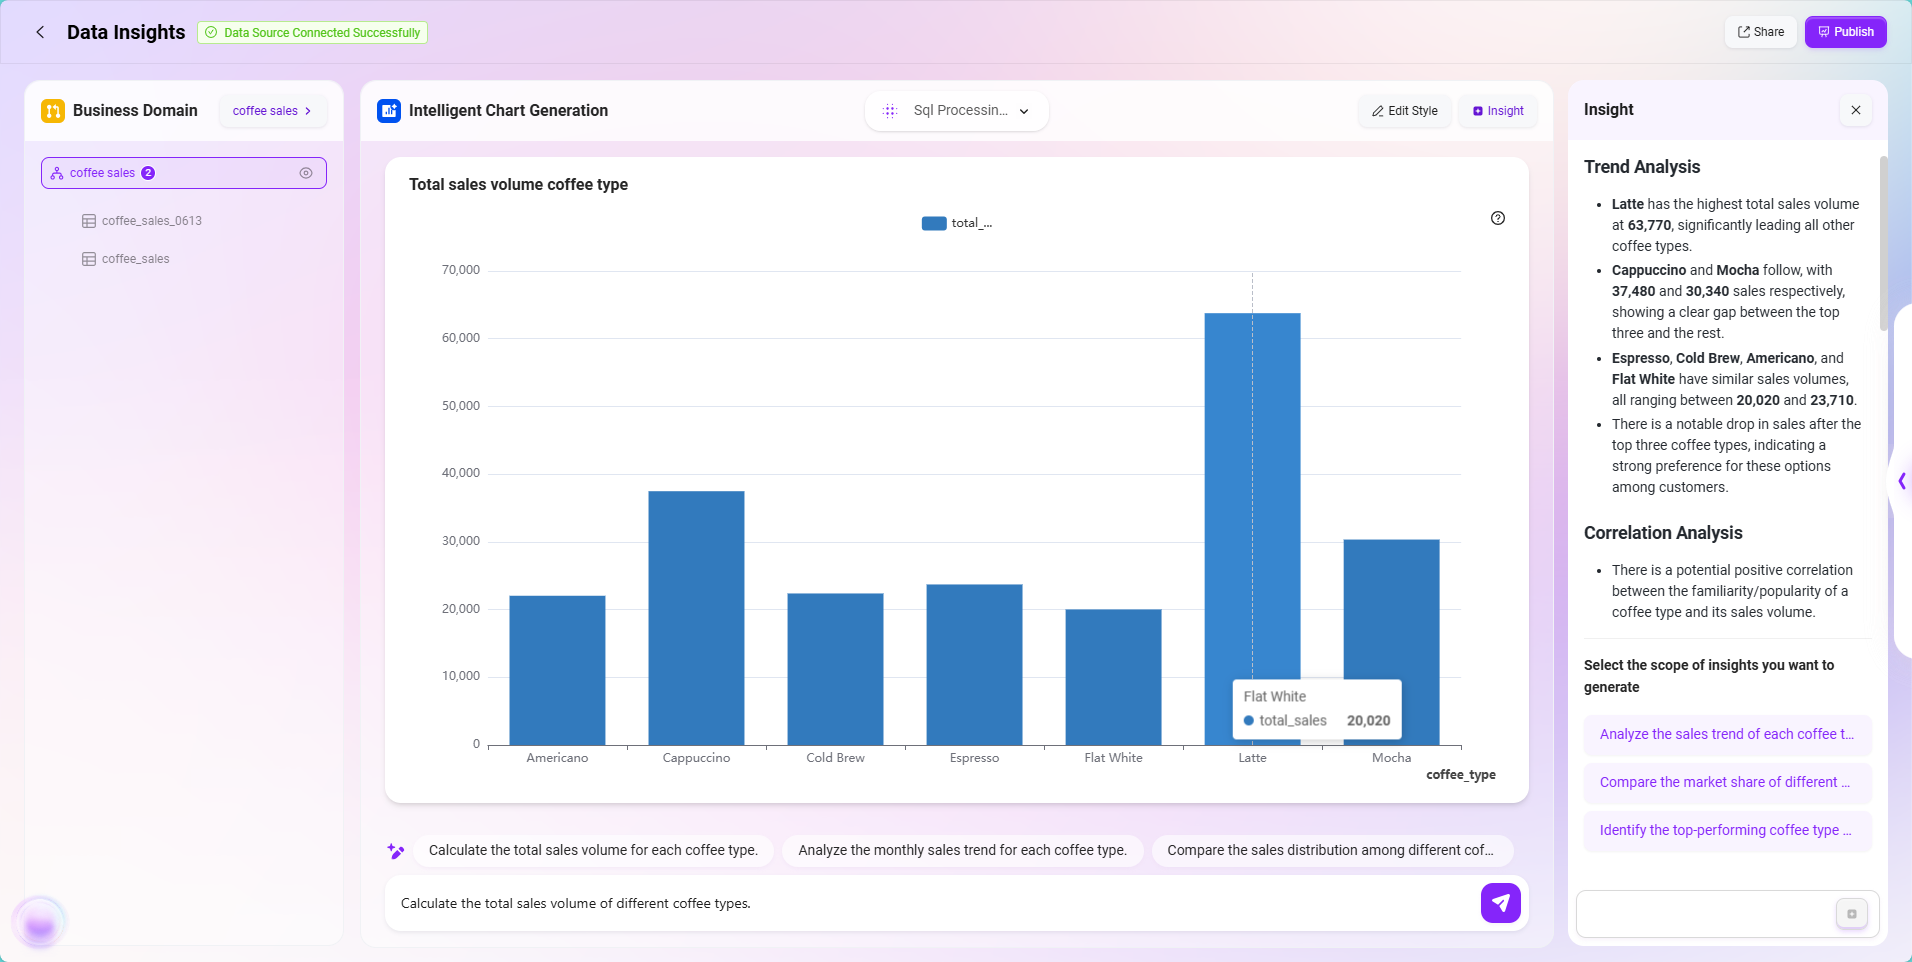
Generate Charts Using Natural Language Queries
Intelligent BI supports natural language analysis, greatly lowering the threshold for data analysis. Here is a practical example:
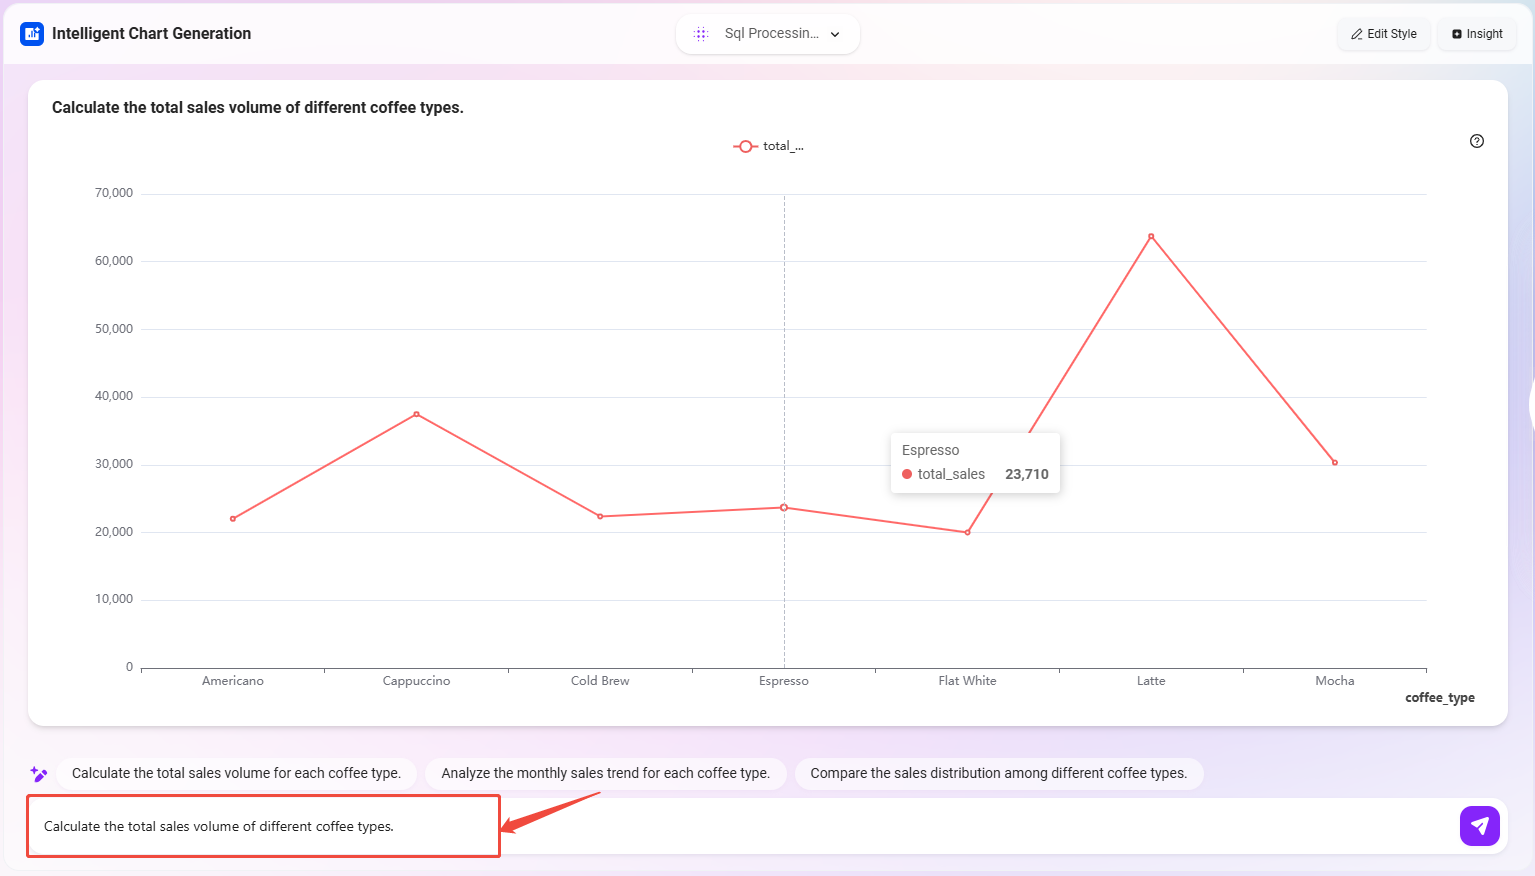
- Enter the following in the natural language input box at the top of the page:
统计不同咖啡类型的销售总量(Calculate the total sales of different coffee types) - After receiving the request, the system will automatically recognize the analysis intent and generate the corresponding SQL query statement.
- After the query is executed, the system will automatically generate a visual chart.
By default, the system usually displays data as a line chart. But in this example, we focus more on comparing total sales, so a bar chart is more suitable.
Adjust Chart Style
To enhance the readability and visual effect of the report, we can optimize the chart style:
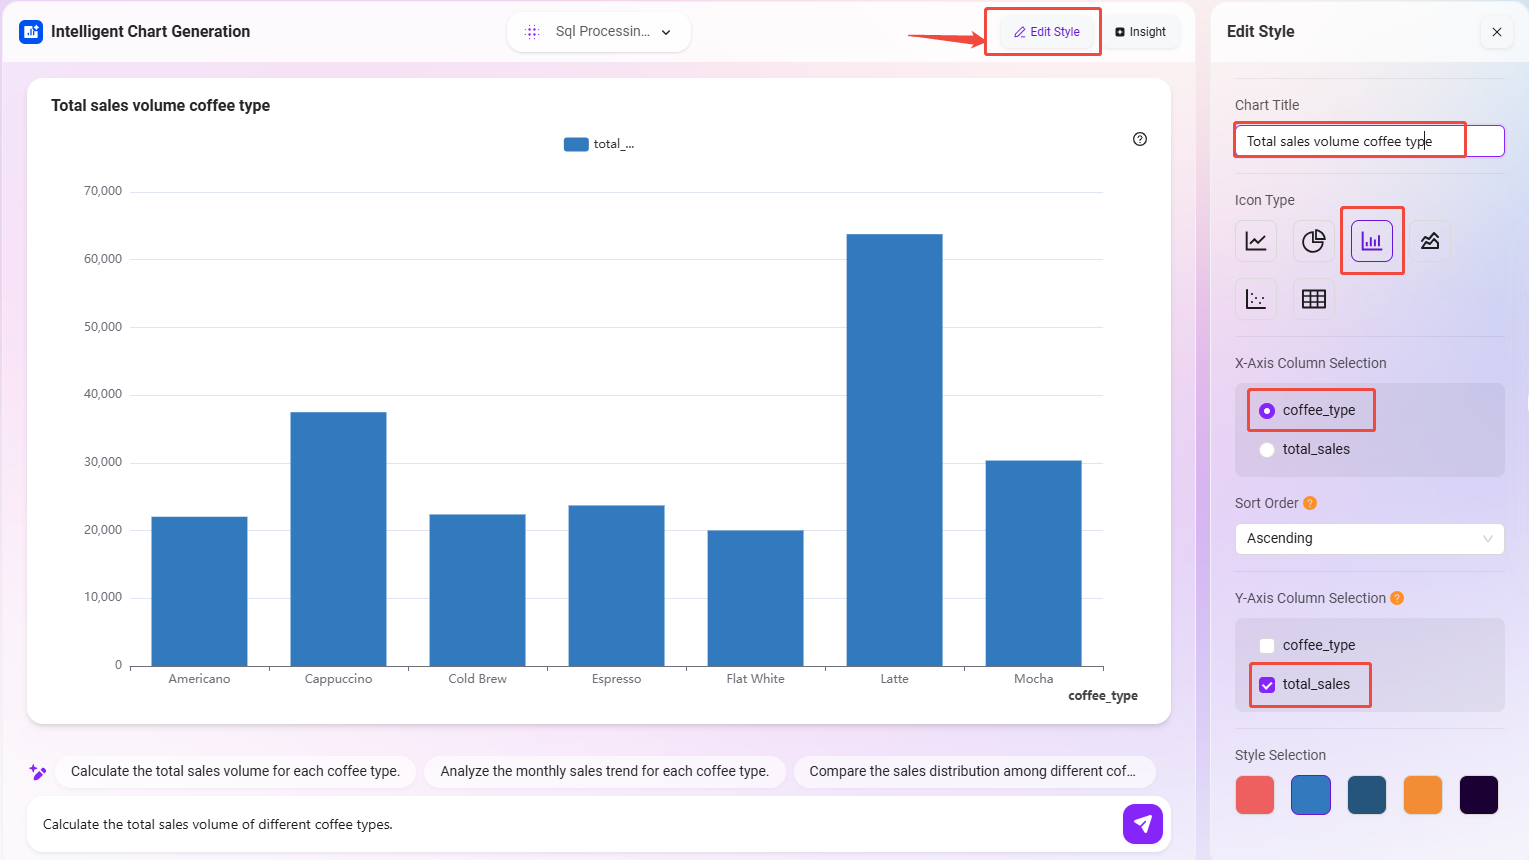
- Click the "Edit Style" button at the top right of the chart.
- The Style Editing Panel will pop up on the right side of the page, where you can customize the chart’s display effects.
The style settings used in this example are:
- Chart Title: change to
Total Sales (Coffee Type) - Chart Type: select
Bar Chart - X-axis Field:
coffee_type(coffee type) - Y-axis Field:
total_sales(total sales) - Theme Style: can be selected according to business scenarios and personal preferences; here, blue style is recommended to highlight a clear and professional visual feel.
The system supports real-time preview of chart styles, allowing you to see changes as you adjust, avoiding the inconvenience of repeated modifications.
After completing the above settings, an intuitive, clear, and data-driven coffee sales analysis chart is built, providing a good foundation for subsequent insights.
Enable Intelligent Data Insights
After completing the sales report construction, we can further utilize the system’s intelligent insight feature to mine potential trends and business opportunities from the data, assisting deeper analysis and decision-making.
Quickly Generate Automatic Insights
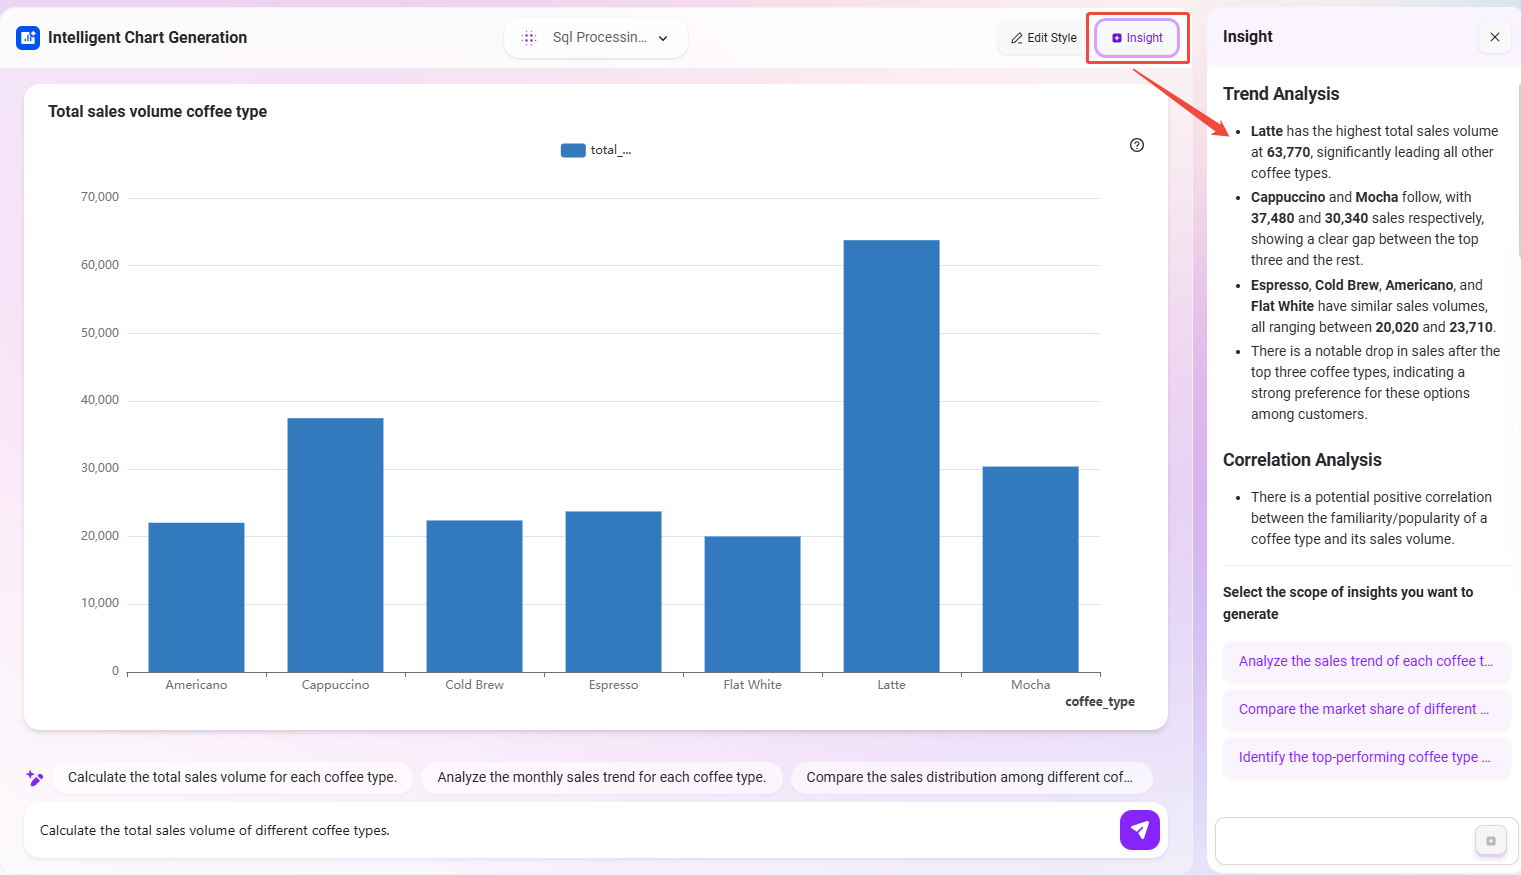
- Click the "Insights" button at the top right of the report page.
- The system will automatically perform intelligent analysis based on the current chart’s dimensions and metrics and output a set of data insight results.
These automatically generated insights include but are not limited to:
- Trend Analysis: identify sales change trends, such as a certain coffee type’s sales significantly rising or falling during a specific period.
- Correlation Analysis: determine correlations between different fields, such as whether there is a sales association between a coffee type and store location.
- Difference Analysis: identify significant differences between categories, such as sales performance differences of different coffee types across regions.
- Data Summary: the system automatically extracts key conclusions based on chart content, facilitating quick understanding of the business meaning behind the data.
Customize Natural Language Insights
Besides system automatic insights, you can also input more specific analysis requirements and initiate deep insights in natural language form.
- Enter in the input box below:
各咖啡类型在总销售中的占比变化(The proportion change of each coffee type in total sales) - The system will generate new data queries and analysis logic based on this question and return insights related to this topic.
This method is especially suitable for business personnel to explore data through "questioning," quickly obtaining valuable information. By combining automatic and customized approaches, the insight feature not only expands the applicability of charts but also further enhances the intelligence and business value of data analysis.
At this point, a complete data access → report creation → intelligent insight sales analysis process has been built, providing the business team with an intuitive, efficient, and intelligent data analysis tool.
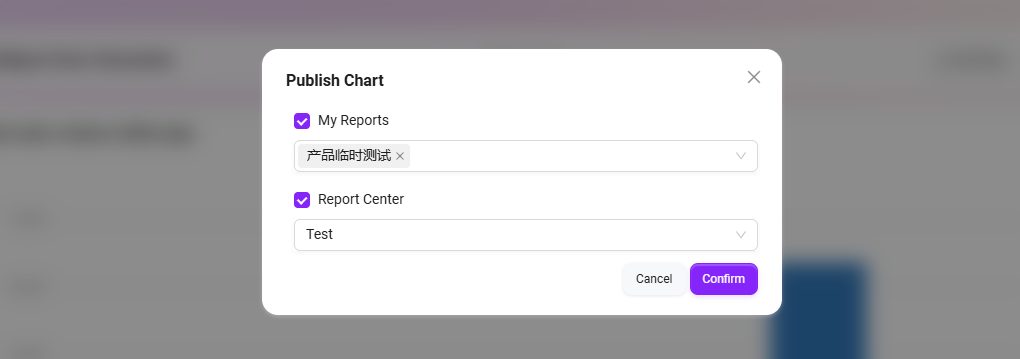
Publish Intelligent BI Reports
After completing report creation, you can publish the report for subsequent viewing or sharing.
The system supports two publishing locations:
- My Reports: visible only to yourself, suitable for personal viewing and saving.
- Report Center: visible to team members, suitable for sharing and collaboration.